
Hanwha Wisenet Retail Insight utiliza las cámaras seguridad para analizar el comportamiento de los clientes
Esta herramienta web utiliza aplicaciones gratuitas de conteo de personas, mapas de calor y gestión de colas que se ejecutan en cámaras Wisenet Q y Wisenet X para mostrar estadísticas de las analíticas, en un panel de control central.
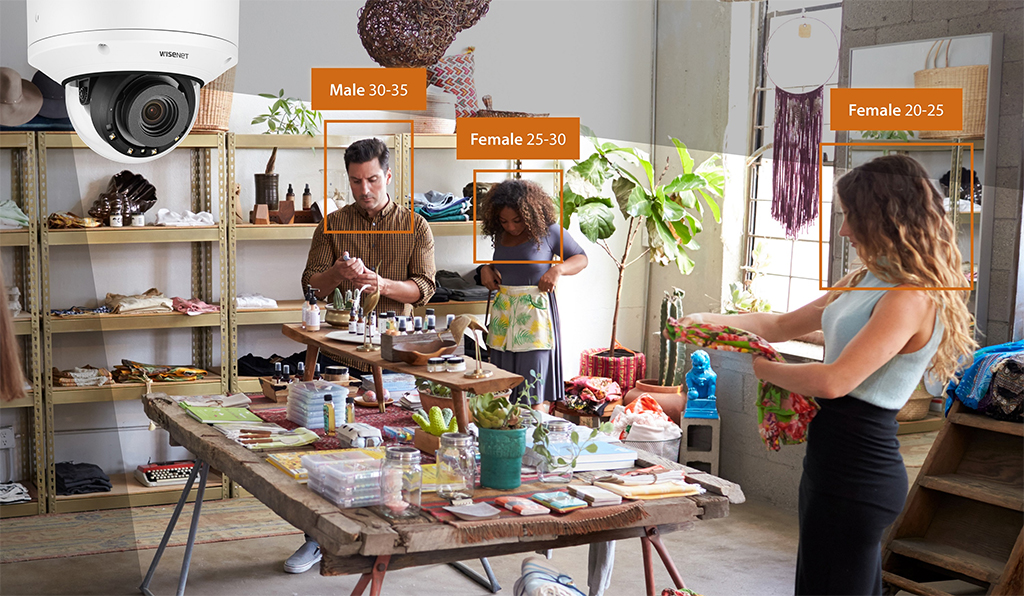
Hanwha Techwin ha presentado una aplicación de inteligencia de negocio que permite a los comercios minoristas comprender mejor el comportamiento y los patrones de compra de los clientes.
Wisenet Retail Insight utiliza aplicaciones gratuitas de conteo de personas, mapas de calor y gestión de colas que se ejecutan en cámaras de las gamas Wisenet Q y Wisenet X (cámaras con lente fija o con tipo ojo de pez) para mostrar estadísticas de las analíticas, en un panel de control central, junto con otras informaciones prácticas como, For example, weather reports.
With access from anywhere on the network, Retail Insight is a web application that consolidates the data captured by the three available analytics applications from a total of 500 cameras from the Wisenet Q or X ranges, presenting them on a customizable dashboard.
Retailers can also leverage the captured data to measure the impact that in-store promotions and other marketing activities may have on store visitors, as well as make better use of human resources to manage the peaks and valleys of customer flow at the checkouts.
'With the threats looming over revenue and profitability, retailers are looking to improve productivity. En cuanto a la inteligencia de negocio que podría ofrecerse para operaciones, marketing, comercialización y gestión de tiendas, es poco probable que los metadatos extraídos tradicionalmente de los sistemas de punto de venta electrónico (EPOS) sean suficientes para que los comerciantes minoristas identifiquen oportunidades que les permita aumentar la productividad o mejorar la experiencia del cliente.”, comments Uri Guterman, Product and Marketing Director, Hanwha Techwin Europe.
Retail Insight genera informes en formato PDF, Excel, CSV o HTML. Con la ayuda de cinco pantallas con pestañas personalizables, los usuarios pueden ver actualizaciones en tiempo real de una amplia gama de actividades, incluida la cantidad de visitantes de la tienda en cualquier momento particular del día o de forma acumulativa durante un período de tiempo específico, así como datos sobre tiempos de congestión de colas e información de mapas de calor que muestra las áreas más ocupadas de una tienda.
¿Te gustó este artículo?
Subscribe to our NEWSLETTER and you won't miss anything.